Data Analysis · Business Intelligence · Customer Analytics · 2026
Customer Churn Analysis and Retention Strategy
A case study on a subscription business using the KKBox dataset. The focus is not just predicting churn, but understanding why it happens. The findings are turned into practical retention strategies.
- 6 monthsData periodOctober 2016–March 2017
- 4 sourcesMerged datasetsOne customer analytical table
- 4 areasAnalysis dimensionsDemographics, subscription, payment, and activity
Case study contents
Objective
Identify the main factors driving churn, analyze customer behavior across subscription, payment, and engagement, then build data driven retention strategies.
Results and limitations
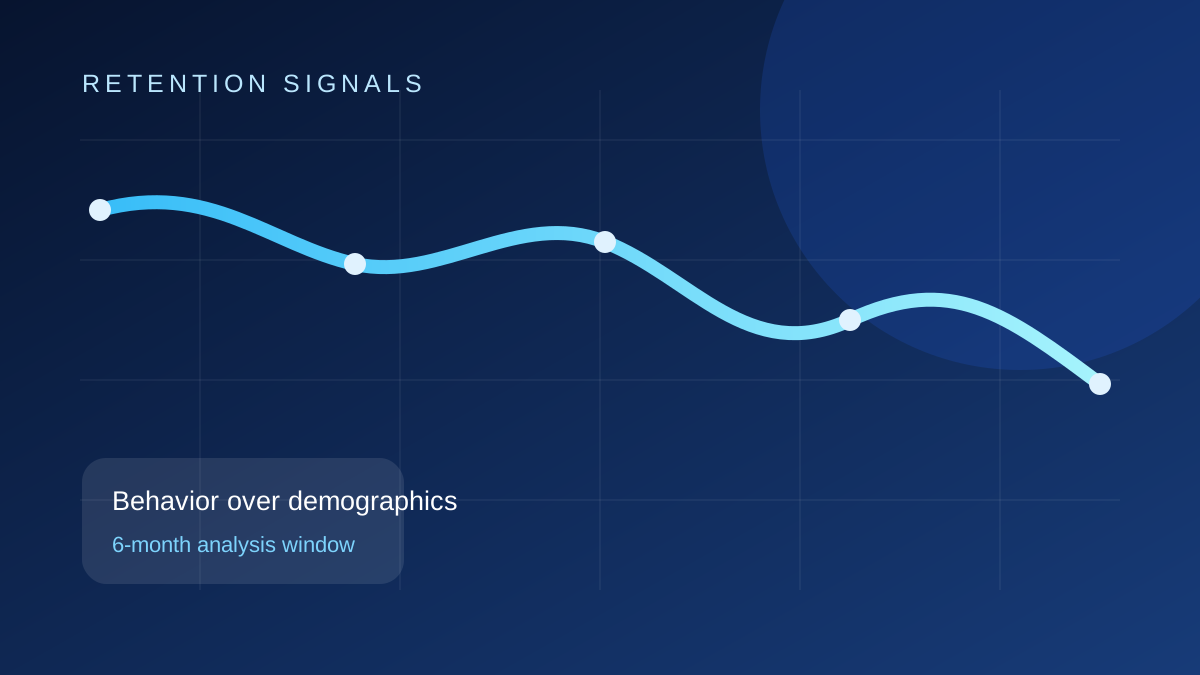
Churn turned out to be driven mainly by behavioral and transactional factors, not demographics. Churn peaks early in the subscription and again during the mid loyalty phase. Discount dependent users showed higher churn, while renewal count was the strongest retention signal. Limitation, this analysis is correlation based, not a predictive model, and only covers October 2016 to March 2017.
Visual evidence
Technical details
Open implementation details
Role and contribution
Worked on the entire analysis alone. Cleaned data from four separate tables, engineered new features, ran exploratory analysis, and developed business insights and retention recommendations.
Methodology
Merged four customer data sources into one analytical table. Cleaned outliers and missing values, then engineered features across four areas, demographics, subscription lifecycle, payment behavior, and user activity. Followed by exploratory analysis and correlation analysis to find churn drivers.
Technologies
- Python
- Pandas
- NumPy
- Matplotlib
- Seaborn
- Jupyter Notebook
- SQL