Data Analysis · Time Series Analysis · Transportation Analytics · 2026
Time Series Analysis of Vehicle Volume on the Merak–Bakauheni Ferry Route
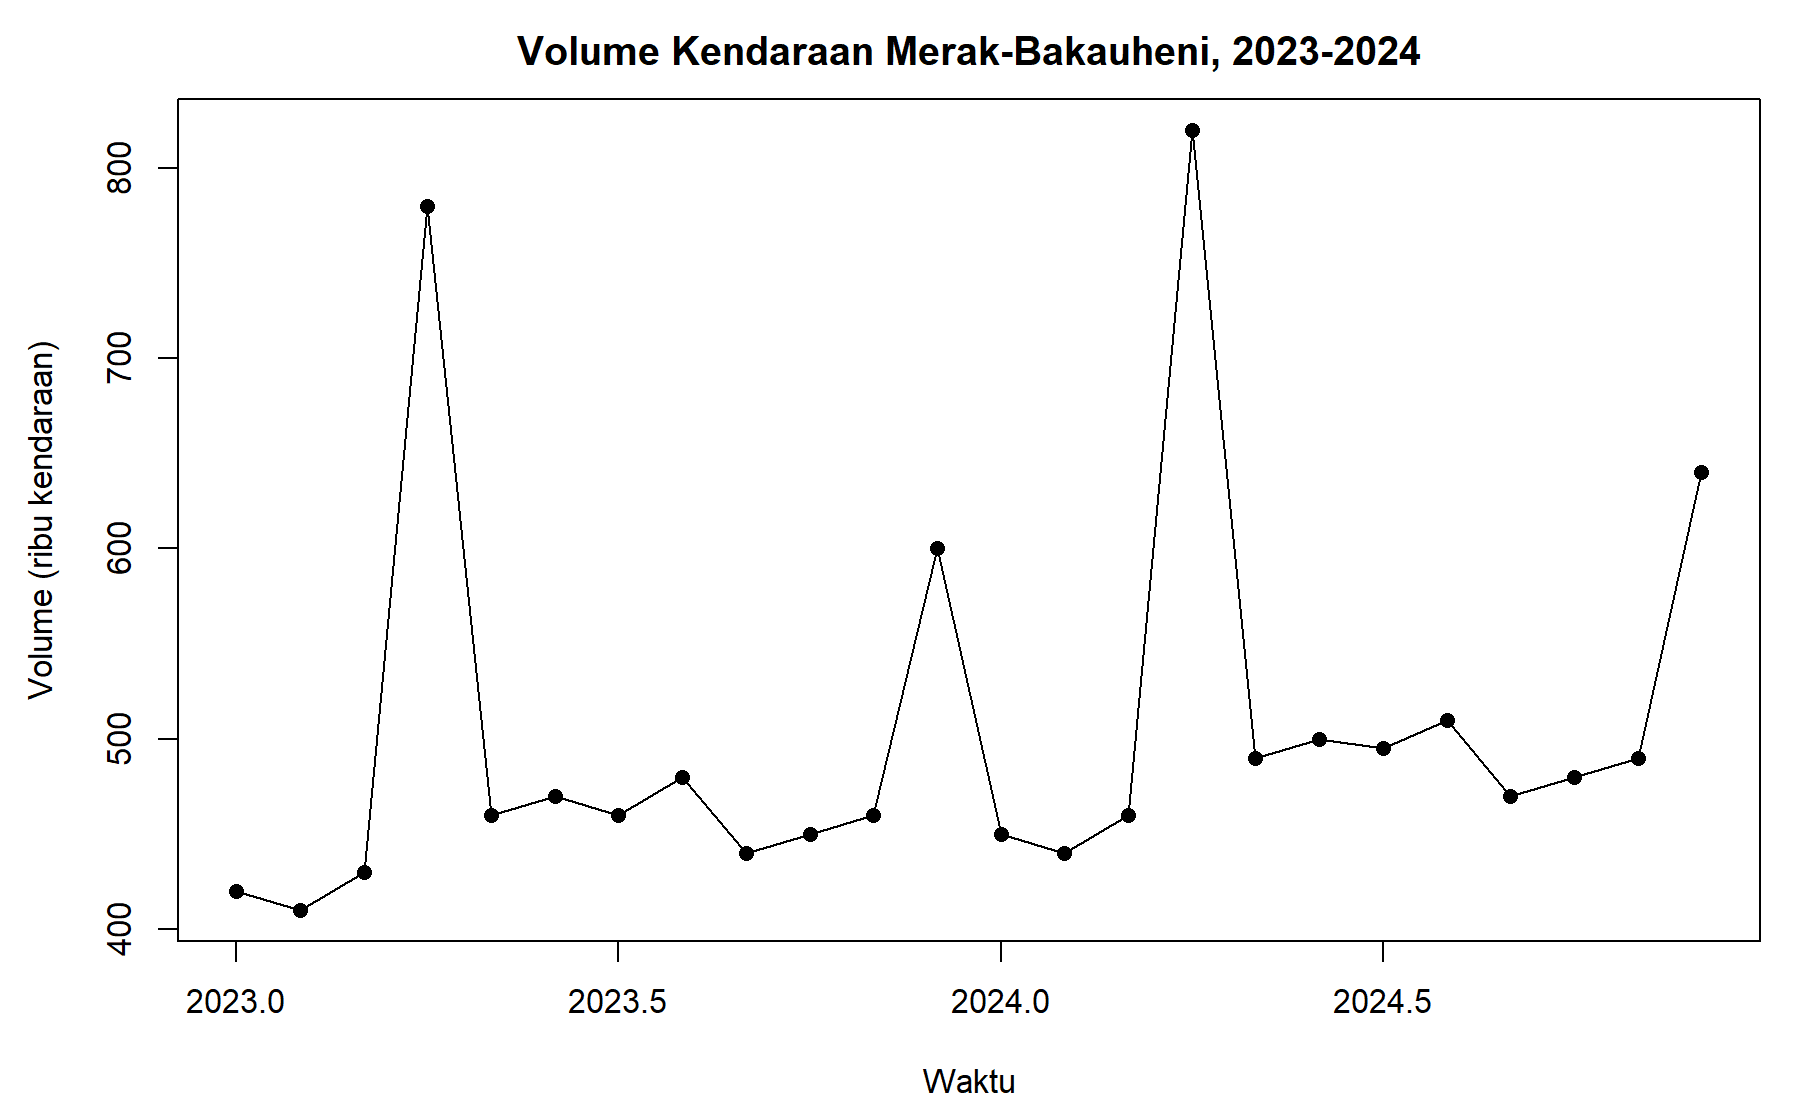
A time series analysis of monthly vehicle crossings on the Merak–Bakauheni ferry route from 2023 to 2024. Using R, the project examines short-term growth and recurring seasonal patterns, with the highest monthly volume reaching 820 thousand vehicles in April 2024.
- 820KPeak volumeApril 2024
- +6.57%Average increaseMonthly average, 2023 → 2024
- 24Monthly observationsJanuary 2023 – December 2024
- 2Recurring peak monthsApril and December
Case study contents
Objective
Analyze monthly vehicle volume on the Merak–Bakauheni route to identify short-term changes, determine peak traffic months, compare patterns across years, and assess whether the observed fluctuations are more consistent with seasonality or multi-year cycles.
Results and limitations
Peak volume reached 820 thousand vehicles in April 2024; average monthly vehicle volume increased by approximately 6.57% from 2023 to 2024.
Every month in 2024 recorded higher vehicle volume than the corresponding month in 2023, with increases of roughly 30–40 thousand vehicles per month. Average monthly volume rose from 488.33 thousand to 520.42 thousand vehicles, an increase of about 6.57%. The main peak occurred repeatedly in April, reaching 780 thousand vehicles in 2023 and 820 thousand in 2024, with another peak in December. The pattern is more consistent with calendar-related seasonality. However, the dataset contains only 24 observations across two years, which is insufficient to establish a long-term trend or multi-year cycle statistically. Monthly boxplots also contain only two observations per calendar month and should therefore be interpreted descriptively.
Visual evidence
Technical details
Open implementation details
Role and contribution
Worked on the entire project independently. Structured the monthly vehicle data as an R time series, performed descriptive trend and seasonal analysis, compared monthly patterns across years, created the visualizations, interpreted recurring peak periods, and documented the analysis in R Markdown.
Methodology
Converted 24 monthly observations from January 2023 to December 2024 into an R ts object with a frequency of 12. The analysis compared each month in 2024 with the corresponding month in 2023, calculated annual averages and year-over-year differences, and used a time-series plot, seasonal plot, and monthly boxplots to examine recurring calendar-related patterns.
Technologies
- R
- R Markdown
- knitr
- rmarkdown
- Base R